Chapter 14 Statistical Inferencehypothesis Testing Statistics 11th Class Punjab MCQ Tests
11th Class Statistics Chapter 14 MCQ Tests
Chapter 14 of 11th Class Statistics has 15 questions. If you take an online MCQ test, the system will randomly choose the questions. If you want to take the quiz by chapter then click the start test button.
Total Questions: 15
Total Marks: 15
Time: 15 Mins
Total Questions: 15
Total Marks: 15
Time: 15 Mins
15Min : 00 Sec Remaining
Question # 1
In a sample of 400 Lahore residents, of which 272 were home owners, and a sample of 600 Karachi residents, of which 390 were home owners. A real estate agent claims that the proportion of home ownership in Lahore exceeds the proportion of home ownership in Karachi. Test this claim at 0.01 significance level.
Question # 2
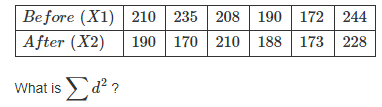
What is ∑ d2?
Question # 3
An inventor has developed a new, energy-efficient lawn mower engine. He claims that the engine will run continuously for 5 hours (300 minutes) on a single gallon of regular gasoline. From his stock of 2000 engines, the inventor selects a simple random sample of 50 engines for testing. The engines run for an average of 295 minutes, with a standard deviation of 20 minutes. Test the null hypothesis that the mean run time is 300 minutes against the alternative hypothesis that the mean run time is not 300 minutes. Use a 0.05 level of significance. (Assume that run times for the population of engines are normally distributed.)
Question # 4
Let X be normal random variable with mean μ and variance 4. For the following hypothesis test H 0 : μ = 1 v s . H a : μ = 2 , we reject H 0 as X ≥ 3 . Calculate α , the probability of making Type I error.
Question # 5
Given μ o = 130 , ¯X = 150 , σ = 25 and n = 4 , what test statistic is appropriate?
Question # 6
In a sample of Pittsburgh residents 25 years of age or older, in which 51 of 150 had at least a Bachelors degree. A sample of 160 Phoenix residents of the same age contained 38 with at least a Bachelors degree. Test the claim that there is a difference in the proportion of adults in Pittsburgh and Phoenix who have at least a Bachelors degree by comparing the calculated Z - score to the 0.05 significance level.
Question # 7
Which of the following values is not typically used for α ?
Question # 8
The NCHS reported that the mean total cholesterol level in 2002 for all adults was 203. Total cholesterol levels in participants who attended the seventh examination of the Offspring in the Framingham Heart Study are summarized as follows: n = 3310, ¯ X = 200.3 , and S = 36.8 . For this what test statistic should be used?
Question # 9
The data below gives the Dividend Yields for the top ten NYSE and NASDAW stocks. Use the t-test tool to determine whether there is any indication of a difference between the means of the two different populations where n 1 = 10 , ¯ X 1 = 95.39 , s 1 = 109.85 , n 2 = 10 , ¯ X 2 = 40.13 , s 2 = 10.36.
Question # 10
A quantitative statement about a population is:
Question # 11
Nine dogs and ten cats were tested to determine if there is a difference in the average number of days that the animal can survive without food. The dogs averaged 11 days with a standard deviation of 2 days while the cats averaged 12 days with a standard deviation of 3 days. What can be concluded? (Use α = .05)
Question # 12
The NCHS report indicated that in 2002, 75% of children aged 2 to 17 saw a dentist in the past year. An investigator wants to assess whether use of dental services is similar in children living in the city of Boston. A sample of 125 children aged 2 to 17 living in Boston are surveyed and 64 reported seeing a dentist over the past 12 months. Is there a significant difference in use of dental services between children living in Boston and the national data?
Question # 13
A region that consists the values which appear to be consistent with the null hypothesis is known as:
Question # 14
To verify whether a course in statistics improved performance, a similar test was given to 12 participants both before and after the course. The original grades recorded in alphabetical order of the participants were 44, 40, 61, 52, 32, 44, 70, 41, 67, 72, 53 and 72. After the course, the grades were in the same order 53, 38, 69, 57, 46, 39, 73, 48, 73, 74, 60 and 78. Test the hypothesis that the course was useful as measured by performance.
Question # 15
In a pair of samples in which 85 of 210 adult men and 60 of 225 adult women were overweight. Test the claim that the proportion of overweight adult men exceeds the proportion of overweight adult women by more than 5% by comparing the calculated Z -score to the critical Z - score at the 0.05 level of significance.
Total Questions
123456789101112131415
Question # 1
In a sample of 400 Lahore residents, of which 272 were home owners, and a sample of 600 Karachi residents, of which 390 were home owners. A real estate agent claims that the proportion of home ownership in Lahore exceeds the proportion of home ownership in Karachi. Test this claim at 0.01 significance level.
Question # 2
What is ∑ d2?
Question # 3
An inventor has developed a new, energy-efficient lawn mower engine. He claims that the engine will run continuously for 5 hours (300 minutes) on a single gallon of regular gasoline. From his stock of 2000 engines, the inventor selects a simple random sample of 50 engines for testing. The engines run for an average of 295 minutes, with a standard deviation of 20 minutes. Test the null hypothesis that the mean run time is 300 minutes against the alternative hypothesis that the mean run time is not 300 minutes. Use a 0.05 level of significance. (Assume that run times for the population of engines are normally distributed.)
Question # 4
Let X be normal random variable with mean μ and variance 4. For the following hypothesis test H 0 : μ = 1 v s . H a : μ = 2 , we reject H 0 as X ≥ 3 . Calculate α , the probability of making Type I error.
Question # 5
Given μ o = 130 , ¯X = 150 , σ = 25 and n = 4 , what test statistic is appropriate?
Question # 6
In a sample of Pittsburgh residents 25 years of age or older, in which 51 of 150 had at least a Bachelors degree. A sample of 160 Phoenix residents of the same age contained 38 with at least a Bachelors degree. Test the claim that there is a difference in the proportion of adults in Pittsburgh and Phoenix who have at least a Bachelors degree by comparing the calculated Z - score to the 0.05 significance level.
Question # 7
Which of the following values is not typically used for α ?
Question # 8
The NCHS reported that the mean total cholesterol level in 2002 for all adults was 203. Total cholesterol levels in participants who attended the seventh examination of the Offspring in the Framingham Heart Study are summarized as follows: n = 3310, ¯ X = 200.3 , and S = 36.8 . For this what test statistic should be used?
Question # 9
The data below gives the Dividend Yields for the top ten NYSE and NASDAW stocks. Use the t-test tool to determine whether there is any indication of a difference between the means of the two different populations where n 1 = 10 , ¯ X 1 = 95.39 , s 1 = 109.85 , n 2 = 10 , ¯ X 2 = 40.13 , s 2 = 10.36.
Question # 10
A quantitative statement about a population is:
Question # 11
Nine dogs and ten cats were tested to determine if there is a difference in the average number of days that the animal can survive without food. The dogs averaged 11 days with a standard deviation of 2 days while the cats averaged 12 days with a standard deviation of 3 days. What can be concluded? (Use α = .05)
Question # 12
The NCHS report indicated that in 2002, 75% of children aged 2 to 17 saw a dentist in the past year. An investigator wants to assess whether use of dental services is similar in children living in the city of Boston. A sample of 125 children aged 2 to 17 living in Boston are surveyed and 64 reported seeing a dentist over the past 12 months. Is there a significant difference in use of dental services between children living in Boston and the national data?
Question # 13
A region that consists the values which appear to be consistent with the null hypothesis is known as:
Question # 14
To verify whether a course in statistics improved performance, a similar test was given to 12 participants both before and after the course. The original grades recorded in alphabetical order of the participants were 44, 40, 61, 52, 32, 44, 70, 41, 67, 72, 53 and 72. After the course, the grades were in the same order 53, 38, 69, 57, 46, 39, 73, 48, 73, 74, 60 and 78. Test the hypothesis that the course was useful as measured by performance.
Question # 15
In a pair of samples in which 85 of 210 adult men and 60 of 225 adult women were overweight. Test the claim that the proportion of overweight adult men exceeds the proportion of overweight adult women by more than 5% by comparing the calculated Z -score to the critical Z - score at the 0.05 level of significance.
Total Questions
123456789101112131415
Statistics MCQ Test by Topics
- +14.1 Basic Concepts
- +14.2 Testing Hypothesis about Population Mean
- +14.3 Testing Hypothesis about Population Proportion
Statistics
- Representation and Exploration of Data
- Measure of Central Tendency or Averages
- Measures of Dispersion
- Index Numbers
- Regression and Correlation Analysis
- Analysis of Time Series
- Set Theory
- Introduction to Probability
- Random Variables and Distributions
- Binomial and Hypergeometric Distributions
- The Normal Distribution
- Sampling and Sampling Distributions
- Statistical Inference:Estimation
- Statistical Inference:Hypothesis Testing
- Association of Attributes


11th Class Online Classes 2026
Updated on: 22-05-2026
11th Class Online Preparation
11th Class 2026 Online
11th Class 2026
Add a Comment
Comments will be shown after admin approval.
Spam comments will not be approved at all.
Matric Result 2026 Punjab
10th Class Result 2026 Punjab
9th Class Result 2026 Punjab Boards
10th Class Result Gazette 2026 Punjab
Punjab Past Papers Matric 9th 10th
Primary Results 5th & 8th Class
BISE Results Intermediate & Matric
BISE Punjab Boards
Sindh Educational Boards
KPK Examination Boards
Technical Boards
Public Service Commission
University Results Gruaduation, Masters Classes
Subscribe by Email
Subscribe by Email
Subscribe to Rss Feed
Position Holders Matric 2026
Position Holders 9th Class 2026
Position Holders Inter 2026
Position Holders 11th Class 2026
Punjab 11th Class Statistics