Chapter 1 Representation And Exploration Of Data Statistics 11th Class Punjab MCQ Tests
11th Class Statistics Chapter 1 MCQ Tests
Chapter 1 of 11th Class Statistics has 23 questions. If you take an online MCQ test, the system will randomly choose the questions. If you want to take the quiz by chapter then click the start test button.
Total Questions: 23
Total Marks: 23
Time: 25 Mins
Total Questions: 23
Total Marks: 23
Time: 25 Mins
25Min : 00 Sec Remaining
Question # 1
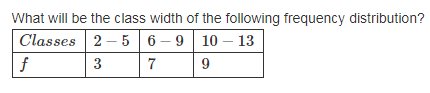
What will be the class width of the following frequency distribution?
Question # 2
Number of bank accounts of a person is an example of:
Question # 3
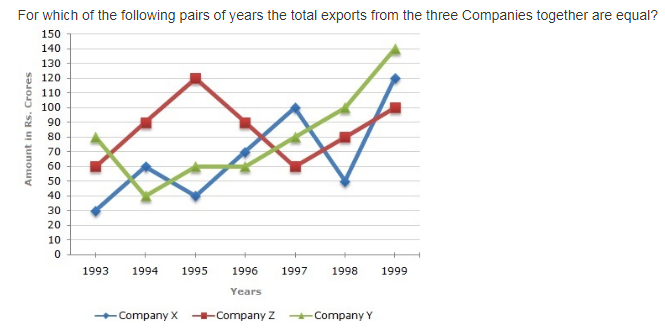
For which of the following pairs of years the total exports from the three Companies together are equal?
Question # 4
Colour of Eyes is a:
Question # 5
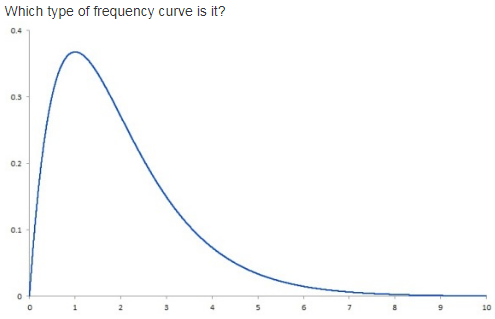
Which type of frequency curve is it?
Question # 6
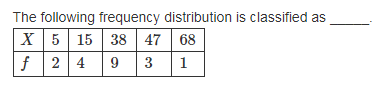
The following frequency distribution is classified as _____.
Question # 7
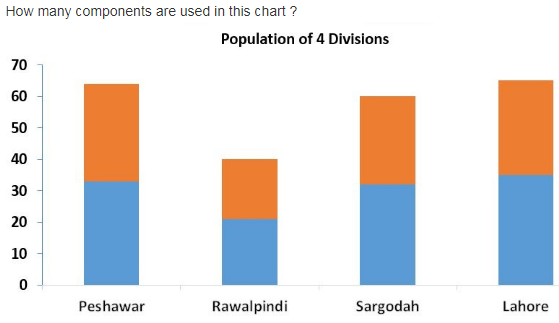
How many components are used in this chart ?
Question # 8
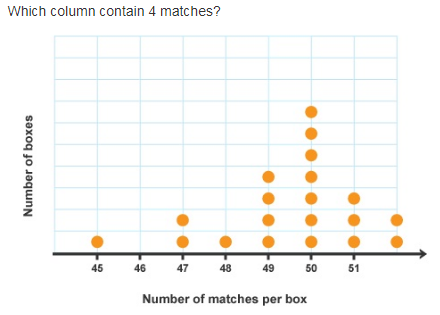
Which column contain 4 matches?
Question # 9
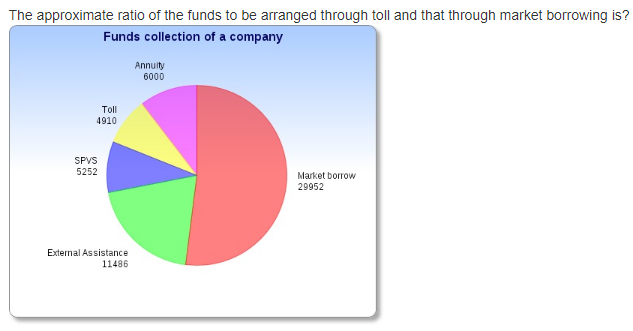
The approximate ratio of the funds to be arranged through toll and that through market borrowing is?
Question # 10
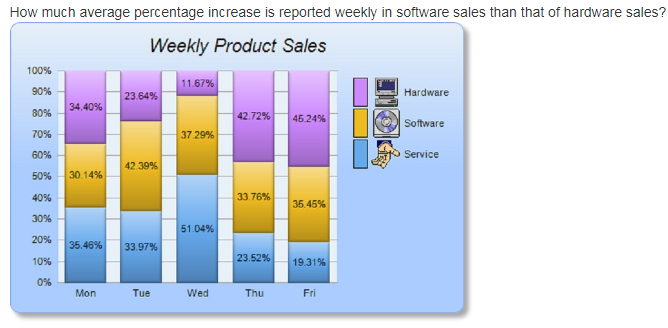
How much average percentage increase is reported weekly in software sales than that of hardware sales?
Question # 11
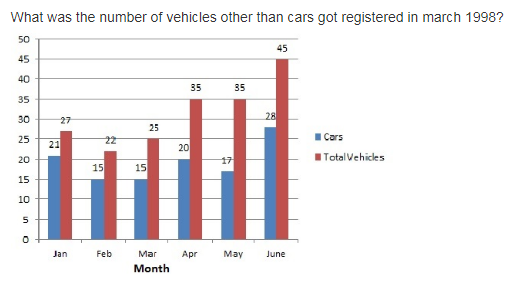
What was the number of vehicles other than cars got registered in march 1998?
Question # 12
Eggs in a tray represents:
Question # 13
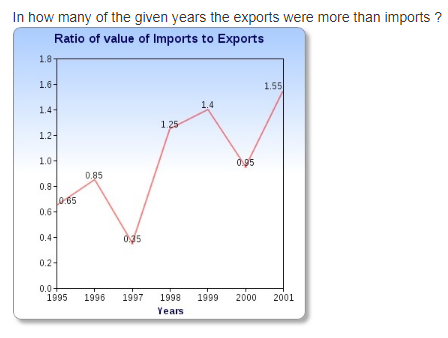
In how many of the given years the exports were more than imports ?
Question # 14
Which type of frequency curve will be made from this frequency distribution?

Question # 15
What will be on average the weekly earning of two classes having highest earnings?

Question # 16
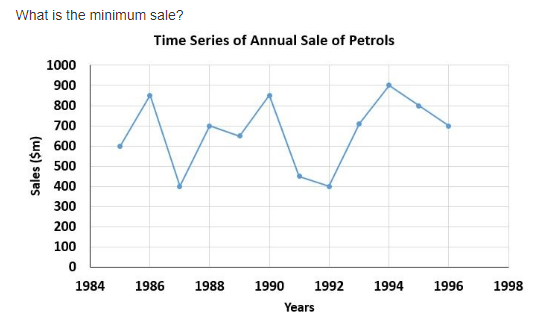
What is the minimum sale?
Question # 17
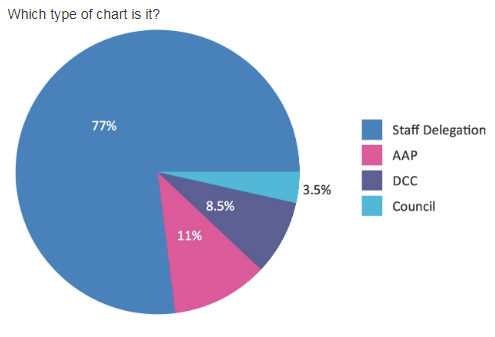
Which type of chart is it?
Question # 18
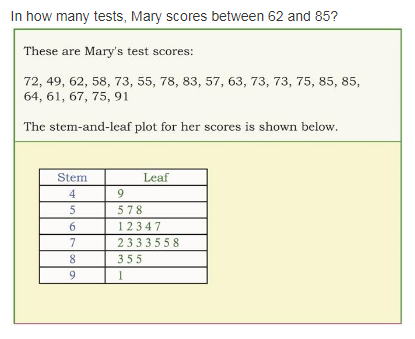
In how many tests, Mary scores between 62 and 85?
Question # 19
What percentage increase in number of workers of class with highest weekly wages as compared to class with lowest weekly wages?

Question # 20
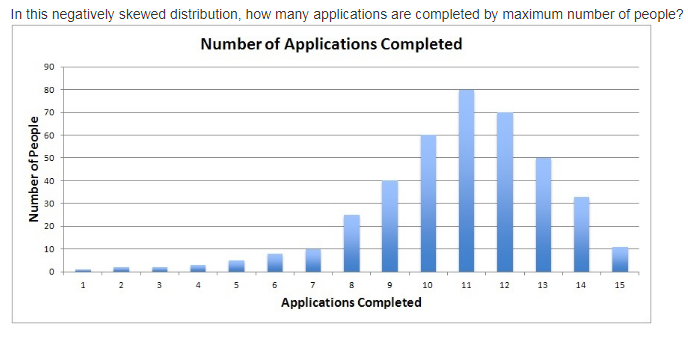
In this negatively skewed distribution, how many applications are completed by maximum number of people?
Question # 21
The Average salary of all workers in a factory is:
Question # 22
Find the precentage increase in number of workers of two classes with highest weekly wages as compared to two classes with lowest weekly wages. See table below:

Question # 23
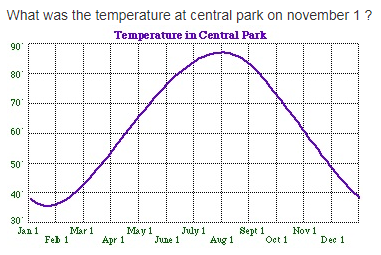
What was the temperature at central park on november 1 ?
Total Questions
1234567891011121314151617181920212223
Question # 1
What will be the class width of the following frequency distribution?
Question # 2
Number of bank accounts of a person is an example of:
Question # 3
For which of the following pairs of years the total exports from the three Companies together are equal?
Question # 4
Colour of Eyes is a:
Question # 5
Which type of frequency curve is it?
Question # 6
The following frequency distribution is classified as _____.
Question # 7
How many components are used in this chart ?
Question # 8
Which column contain 4 matches?
Question # 9
The approximate ratio of the funds to be arranged through toll and that through market borrowing is?
Question # 10
How much average percentage increase is reported weekly in software sales than that of hardware sales?
Question # 11
What was the number of vehicles other than cars got registered in march 1998?
Question # 12
Eggs in a tray represents:
Question # 13
In how many of the given years the exports were more than imports ?
Question # 14
Which type of frequency curve will be made from this frequency distribution?
Question # 15
What will be on average the weekly earning of two classes having highest earnings?
Question # 16
What is the minimum sale?
Question # 17
Which type of chart is it?
Question # 18
In how many tests, Mary scores between 62 and 85?
Question # 19
What percentage increase in number of workers of class with highest weekly wages as compared to class with lowest weekly wages?
Question # 20
In this negatively skewed distribution, how many applications are completed by maximum number of people?
Question # 21
The Average salary of all workers in a factory is:
Question # 22
Find the precentage increase in number of workers of two classes with highest weekly wages as compared to two classes with lowest weekly wages. See table below:
Question # 23
What was the temperature at central park on november 1 ?
Total Questions
1234567891011121314151617181920212223
Statistics MCQ Test by Topics
- +1.1 Exploring and Interpreting Data
- +1.2 Frequency Distribution
- +1.3 Charts/Diagrams
- +1.4 Graphs
- +1.5 Types of Frequency Curves
Statistics
- Representation and Exploration of Data
- Measure of Central Tendency or Averages
- Measures of Dispersion
- Index Numbers
- Regression and Correlation Analysis
- Analysis of Time Series
- Set Theory
- Introduction to Probability
- Random Variables and Distributions
- Binomial and Hypergeometric Distributions
- The Normal Distribution
- Sampling and Sampling Distributions
- Statistical Inference:Estimation
- Statistical Inference:Hypothesis Testing
- Association of Attributes










11th Class Online Classes 2026
Updated on: 14-10-2026
11th Class Online Preparation
11th Class 2026 Online
11th Class 2026
Add a Comment
Comments will be shown after admin approval.
Spam comments will not be approved at all.
Matric Result 2026 Punjab
10th Class Result 2026 Punjab
9th Class Result 2026 Punjab Boards
10th Class Result Gazette 2026 Punjab
Punjab Past Papers Matric 9th 10th
Primary Results 5th & 8th Class
BISE Results Intermediate & Matric
BISE Punjab Boards
Sindh Educational Boards
KPK Examination Boards
Technical Boards
Public Service Commission
University Results Gruaduation, Masters Classes
Subscribe by Email
Subscribe by Email
Subscribe to Rss Feed


Position Holders Matric 2026
Position Holders 9th Class 2026
Position Holders Inter 2026
Position Holders 11th Class 2026
Punjab 11th Class Statistics