Testing Hypothesis About Population Mean MCQ Tests
11th Class Statistics MCQ Tests
Testing Hypothesis About Population Mean
of 11th Class Statistics has 5 questions. If you take an online MCQ test, the system will randomly choose the questions. If you want to take the quiz by chapter then click the start test button.
Total Questions: 5
Total Marks: 5
Time: 5 Mins
Total Questions: 5
Total Marks: 5
Time: 5 Mins
5Min : 00 Sec Remaining
Question # 1
Nine dogs and ten cats were tested to determine if there is a difference in the average number of days that the animal can survive without food. The dogs averaged 11 days with a standard deviation of 2 days while the cats averaged 12 days with a standard deviation of 3 days. What can be concluded? (Use α = .05)
Question # 2
The data below gives the Dividend Yields for the top ten NYSE and NASDAW stocks. Use the t-test tool to determine whether there is any indication of a difference between the means of the two different populations where n 1 = 10 , ¯ X 1 = 95.39 , s 1 = 109.85 , n 2 = 10 , ¯ X 2 = 40.13 , s 2 = 10.36.
Question # 3
An inventor has developed a new, energy-efficient lawn mower engine. He claims that the engine will run continuously for 5 hours (300 minutes) on a single gallon of regular gasoline. From his stock of 2000 engines, the inventor selects a simple random sample of 50 engines for testing. The engines run for an average of 295 minutes, with a standard deviation of 20 minutes. Test the null hypothesis that the mean run time is 300 minutes against the alternative hypothesis that the mean run time is not 300 minutes. Use a 0.05 level of significance. (Assume that run times for the population of engines are normally distributed.)
Question # 4
To verify whether a course in statistics improved performance, a similar test was given to 12 participants both before and after the course. The original grades recorded in alphabetical order of the participants were 44, 40, 61, 52, 32, 44, 70, 41, 67, 72, 53 and 72. After the course, the grades were in the same order 53, 38, 69, 57, 46, 39, 73, 48, 73, 74, 60 and 78. Test the hypothesis that the course was useful as measured by performance.
Question # 5
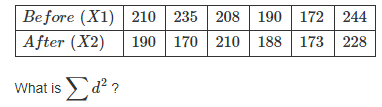
What is ∑ d2?
Total Questions
12345
Question # 1
Nine dogs and ten cats were tested to determine if there is a difference in the average number of days that the animal can survive without food. The dogs averaged 11 days with a standard deviation of 2 days while the cats averaged 12 days with a standard deviation of 3 days. What can be concluded? (Use α = .05)
Question # 2
The data below gives the Dividend Yields for the top ten NYSE and NASDAW stocks. Use the t-test tool to determine whether there is any indication of a difference between the means of the two different populations where n 1 = 10 , ¯ X 1 = 95.39 , s 1 = 109.85 , n 2 = 10 , ¯ X 2 = 40.13 , s 2 = 10.36.
Question # 3
An inventor has developed a new, energy-efficient lawn mower engine. He claims that the engine will run continuously for 5 hours (300 minutes) on a single gallon of regular gasoline. From his stock of 2000 engines, the inventor selects a simple random sample of 50 engines for testing. The engines run for an average of 295 minutes, with a standard deviation of 20 minutes. Test the null hypothesis that the mean run time is 300 minutes against the alternative hypothesis that the mean run time is not 300 minutes. Use a 0.05 level of significance. (Assume that run times for the population of engines are normally distributed.)
Question # 4
To verify whether a course in statistics improved performance, a similar test was given to 12 participants both before and after the course. The original grades recorded in alphabetical order of the participants were 44, 40, 61, 52, 32, 44, 70, 41, 67, 72, 53 and 72. After the course, the grades were in the same order 53, 38, 69, 57, 46, 39, 73, 48, 73, 74, 60 and 78. Test the hypothesis that the course was useful as measured by performance.
Question # 5
What is ∑ d2?
Total Questions
12345
Statistics
- Representation and Exploration of Data
- Measure of Central Tendency or Averages
- Measures of Dispersion
- Index Numbers
- Regression and Correlation Analysis
- Analysis of Time Series
- Set Theory
- Introduction to Probability
- Random Variables and Distributions
- Binomial and Hypergeometric Distributions
- The Normal Distribution
- Sampling and Sampling Distributions
- Statistical Inference:Estimation
- Statistical Inference:Hypothesis Testing
- Association of Attributes


11th Class Online Classes 2026
Updated on: 21-05-2026
11th Class Online Preparation
11th Class 2026 Online
11th Class 2026
Add a Comment
Comments will be shown after admin approval.
Spam comments will not be approved at all.
Matric Result 2026 Punjab
10th Class Result 2026 Punjab
9th Class Result 2026 Punjab Boards
10th Class Result Gazette 2026 Punjab
Punjab Past Papers Matric 9th 10th
Primary Results 5th & 8th Class
BISE Results Intermediate & Matric
BISE Punjab Boards
Sindh Educational Boards
KPK Examination Boards
Technical Boards
Public Service Commission
University Results Gruaduation, Masters Classes
Subscribe by Email
Subscribe by Email
Subscribe to Rss Feed
Position Holders Matric 2026
Position Holders 9th Class 2026
Position Holders Inter 2026
Position Holders 11th Class 2026
Punjab 11th Class Statistics Testing Hypothesis About Population Mean